The neighbourhood looks well supplied
Gardens, groceries, meal programs, and frequent transit all appear in or near the DTES. Yet 42% of respondents reported concern about food security in 2023.
42%food-security concern
A Vancouver food-access story
I started with a simple question: if a neighbourhood has plenty of gardens, grocery stores, meal programs, and transit stops, does that mean people can get the food they need? The Downtown Eastside shows why the answer is more complicated.
What the research showed
A place on the map only becomes useful when a person can actually use it.
Price, waitlists, referrals, opening hours, transportation, dietary needs, and unreliable supply can all break this chain.
01 · Explore the Downtown Eastside
The map contains 11 food resources and five major transit locations. Search by name, filter the categories, turn labels on, and select any point to see what access looks like beyond distance.
Loading the Downtown Eastside food-access map…
The interactive markers and access zones are available, but the street-map tiles could not load. Check your connection or content-blocking settings.
Gardens, groceries, meal programs, and frequent transit all appear in or near the DTES. Yet 42% of respondents reported concern about food security in 2023.
Carnegie serves low-cost meals every day. Evelyne Saller offers $2 full-course meals. The DTES Neighbourhood House runs low-barrier programs. Their hours, food choices, stability, and rules are not the same.
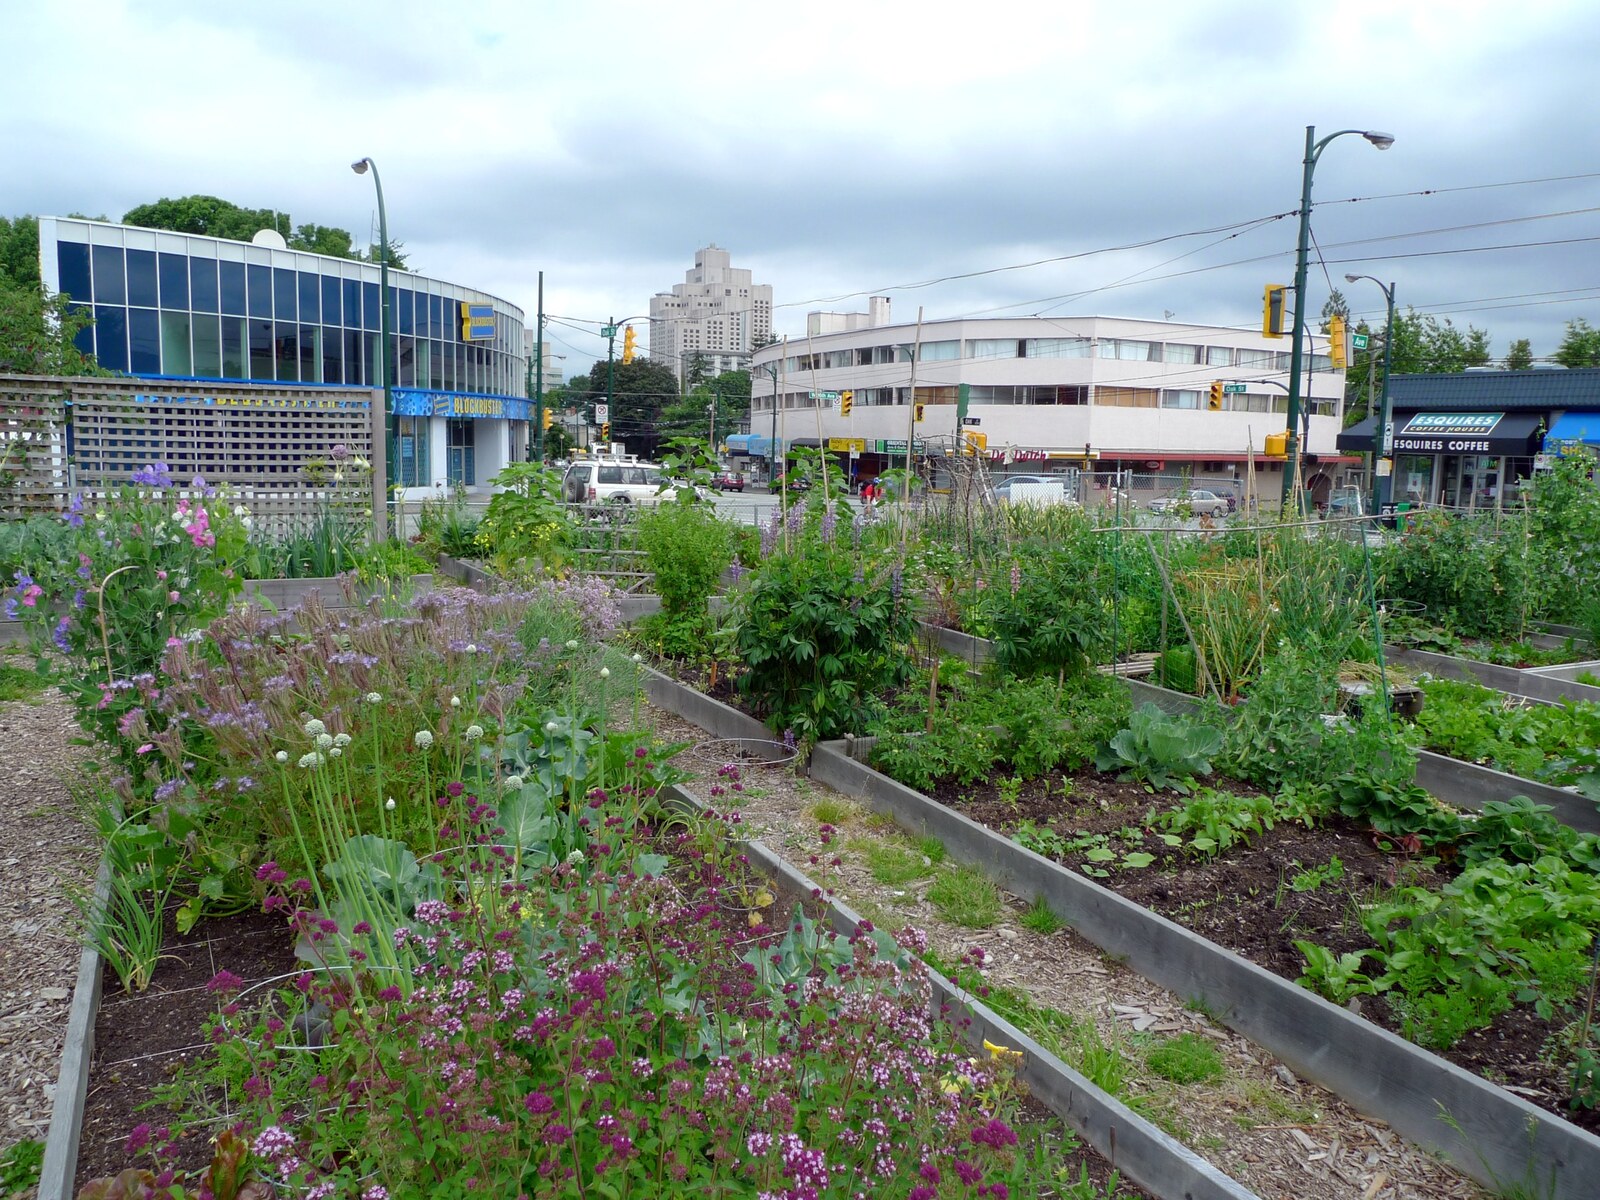
At Strathcona, people join a work party before plots are assigned from a waitlist. Cottonwood also reports a waitlist and expects members to volunteer. Those systems keep the gardens running, but a nearby plot may still be unavailable for years.
About 1,000 buses use Hastings Street each day. That sounds excellent—until reliability enters the picture. TransLink also calls Hastings one of the region's most delayed corridors.
A 500 m circle answers one question: “Is it nearby?” It cannot tell us whether someone can afford it, qualify, arrive during opening hours, get off a waitlist, or find food that meets their needs.
Apply the effective-access test02 · Neighbourhood comparison
The same 2023 survey measured reported food-security concern in all four areas. The numbers reveal a sharp contrast, but they do not tell us by themselves what caused it.
People reporting food-security concern · 2023
Choose a neighbourhood to see what may be shaping the result.
Source: City of Vancouver, Equitable Access to Healthy Food Retail, drawing on the 2023 BCCDC SPEAK survey.
Distance and affordability overlap
Sunset has grocery stores, but they are concentrated along particular commercial streets. Some residential areas are farther away, and the South Vancouver Community Food Hub is already full.
| Study area | What exists | What interrupts access | Main lesson |
|---|---|---|---|
| Downtown Eastside | Many food programs, gardens, stores, and a major bus corridor | Cost, eligibility, limited capacity, dietary fit, unstable supply, and delayed buses | A high number of resources does not guarantee security |
| Kitsilano | Full-service stores, a seasonal market, and gardens | Years-long garden queues and limited coupon spaces | Garden scarcity does not automatically mean widespread food insecurity |
| Sunset | Retail corridors, gardens, and a community food hub | Longer distances from some homes, lower incomes, and full programs | Having stores nearby does not make them equally usable |
| Grandview-Woodland | A strong food network, retail streets, and a major transit hub | Waitlists, temporary garden land, and limited program capacity | Good infrastructure helps, but it still has limits |
03 · Effective access
Use the switch below. The list changes once price, waitlists, referrals, and reliability are brought into view.
The practical test
The map can show an address. A person still needs to know whether the place is affordable, open, appropriate, and accepting new participants.
Use the switch above to reveal the restrictions hidden behind each address.
Downtown Eastside
The groceries are low-cost and physically nearby, but shoppers need a referral from a social-service agency before they can use the market.
Referral requiredKitsilano
The garden has more than 80 plots, but over 270 people were waiting and the estimated wait was longer than five years.
Waitlist closedSunset service area
The hub offers healthy, culturally appropriate emergency groceries, but it is at capacity and registration is closed.
Full capacityDowntown Eastside
Very low-cost meals every day, although the kitchen cannot meet all dietary needs.
Low-cost · open dailyThe effective-access test
How far is the trip in the real street network?
Can the household realistically pay?
Is there actually a meal, space, or garden plot available?
Are signup, referral, or membership required?
Is it open when a person can get there?
Is the trip practical and dependable?
Does the food fit dietary and cultural needs?
Is access stable, or temporary and donation-dependent?
04 · Four neighbourhood stories
It would be misleading to label one neighbourhood “good” and another “bad.” Each place shows a different way that a promising resource can fall short.
Many visible resources, but food-security concern remains high.
What it shows: a dense cluster of resources can coexist with serious financial and practical barriers.
Stores exist, but they are not equally convenient from every home.
What it shows: distance and purchasing power have to be considered together.
A strong food and transit network that still runs out of space.
What it shows: good infrastructure creates opportunities, but programs can still fill up.
Low reported concern, even though garden and coupon programs are oversubscribed.
What it shows: the length of a garden waitlist does not predict a neighbourhood's overall food security.
05 · A check against Canadian research
A 2025 Public Health Agency of Canada review reached a careful conclusion. Evidence that gardens, food boxes, charities, and school food reduce household food insecurity was limited and uncertain. Food vouchers looked more promising, although that evidence was not definitive either.
That does not make gardens or food charities unimportant. They can provide meals, emergency help, skills, habitat, and community. It simply means that these benefits should not be mistaken for a solution to the economic roots of food insecurity.
Read the systematic review ↗06 · Why gardens still matter
Vancouver supports urban growing for local food, learning, social connection, and sustainability. Pollinator meadows add habitat, healthier soils, biodiversity, and climate benefits. The City reports naturalized meadows in 25 parks and golf courses, plus more than 11 km along boulevards and medians.
“The point is not that gardens fail. The point is that counting gardens cannot tell us whether every household has enough food.”
Sunset Park Community Garden is one of the City's pollinator-related partners. Its ecological value is real, even though it cannot stand in for reliable household access to food.
07 · How the policy changed
Earlier plans focused heavily on building more food infrastructure. Later plans paid more attention to who could use it, who faced barriers, and whose food systems had been excluded.
Municipal commitment to a just and sustainable food system.
Targeted a 50% increase in city and neighbourhood food assets above 2010 levels.
Five goal areas and 72+ actions across production, processing, distribution, access, and waste.
Made equitable access, Indigenous food sovereignty, reconciliation, climate resilience, and barrier removal explicit.
Combined grocery geography and household income to identify Food Retail Priority Zones.
Frames a just food system around people's power to choose what and how they eat.
Park Board food assets and services
The growth is real. The harder question is whether residents can use those new resources equally.
08 · How I approached the map
The first view asks where resources are. The second asks what would have to be true for a resident to use them.
Gardens, food programs, grocery stores, transit stops, and 500 m proximity circles.
Price, capacity, signup, referral, waitlists, opening hours, transportation, dietary fit, and reliability.
Resources reconsidered according to whether access is immediate, dependable, and suitable.
The Downtown Eastside is not the same area as Vancouver's standard Strathcona boundary. It includes seven mixed-income sub-neighbourhoods. Some health survey results also use Community Health Service Areas, which do not line up perfectly with the map.
For that reason, the maps can reveal patterns and contrasts, but they cannot prove that one local feature caused a neighbourhood-wide result.
Dataset structure
09 · Conclusion
The Downtown Eastside has gardens, low-cost meals, groceries, and frequent transit, yet 42% reported concern about food security. Sunset reached 43% even though it also has stores and programs. Grandview-Woodland has strong infrastructure but full programs. Kitsilano has extremely long garden waitlists but much lower reported concern, at 10%.
No single factor explains those differences. Together, however, they show why a count of nearby resources is incomplete. Access also depends on price, travel, eligibility, opening hours, capacity, cultural and dietary fit, and whether the service will still be there next week.
10 · Sources
Different sources answer different questions. City datasets show where resources are; program pages explain their rules; policy documents show changing priorities; and the systematic review tests the larger claim.